


“Any university degree is better than stopping at high school.” It is a familiar argument in Japan. But is it necessarily true?
In Part 1, we examined the wage advantage associated with university education and found that even graduates of less selective universities can achieve positive economic returns.
In Part 2, we calculated a hypothetical cost of approximately ¥15.74 million for attending a private university, combining university fees with the wages a student might otherwise have earned during those four years.
But when we looked at what happens after graduation, a rather unexpected set of numbers emerged.
According to figures released by Japan’s Ministry of Health, Labour and Welfare on October 23, 2026, the difference in three-year job separation rates between high school and university graduates was 5.7 percentage points.
Yet among high school graduates alone, the difference between the smallest and largest workplace-size categories reached 36.9 percentage points.
In this particular measure, the variation associated with workplace size is far greater than the overall gap between educational groups. So how much can an entrance-exam score at 18 really tell us about someone’s career 40 years later?
Are Jobs Scarce for High School Graduates? Japan’s Ratio Was 4.12 Openings per Applicant
Let’s begin by questioning the assumption that entering employment directly after high school means having few opportunities.
In May 2026, the Ministry of Health, Labour and Welfare (MHLW) released employment figures for students graduating from high school that March.
For students seeking employment through school-based placement and Japan’s public employment service, Hello Work, there were approximately 499,000 job openings and 121,000 job seekers.
The job openings-to-applicants ratio stood at 4.12, while the reported job-offer acceptance rate was 98.9%.
In numerical terms, there were roughly 4.1 available positions for every registered job seeker in this system.
That does not mean every applicant could choose freely among four suitable employers. Vacancies differ by region, occupation, working conditions and required skills. The statistics also cover a specific recruitment channel, not every young person leaving school.
For comparison, Japan’s Ministry of Education, Culture, Sports, Science and Technology (MEXT) reported an employment rate of 98.0% for university graduates in March 2026.
But the two percentages come from different survey populations and methods. The university figure comes from a sample survey of graduates seeking employment, so the 98.9% and 98.0% figures cannot be used to declare one educational path superior.
Nevertheless, the data challenge the notion that a young person without a university degree has no realistic route into employment.
Getting a job is one question. Getting into a workplace that offers sustainable opportunities is another.
A 5.7-Point Education Gap, but a 36.9-Point Workplace Gap
Now consider the employment outcomes of those who graduated in March 2023.
In its October 23, 2026 release, MHLW reported that 36.9% of newly employed high school graduates and 31.2% of newly employed university graduates had left their initial jobs within three years.
That is an overall difference of 5.7 percentage points.
So far, the results appear to support the familiar argument that university graduates are more likely to remain in their first jobs.
But separating the same data by the number of employees at the workplace produces a different perspective.
| Workplace size | High school graduates | University graduates |
|---|---|---|
| Fewer than 5 employees | 61.3% | 58.2% |
| 1,000 or more employees | 24.4% | 24.2% |
| Difference between size categories | 36.9 percentage points | 34.0 percentage points |
Original calculations based on MHLW’s October 23, 2026 report on employees who graduated in March 2023. The figures measure separation from the initial job within three years, not unemployment after leaving. Workplace size refers to an establishment, which does not necessarily have the same number of employees as the company as a whole.
The calculations are straightforward:
High school graduates: 61.3% − 24.4% = 36.9 percentage points.
University graduates: 58.2% − 24.2% = 34.0 percentage points.
Compare those differences with the overall high school-versus-university gap of just 5.7 percentage points.
Educational attainment is associated with job retention, but the characteristics of the first workplace are also associated with substantial differences in the observed outcomes.
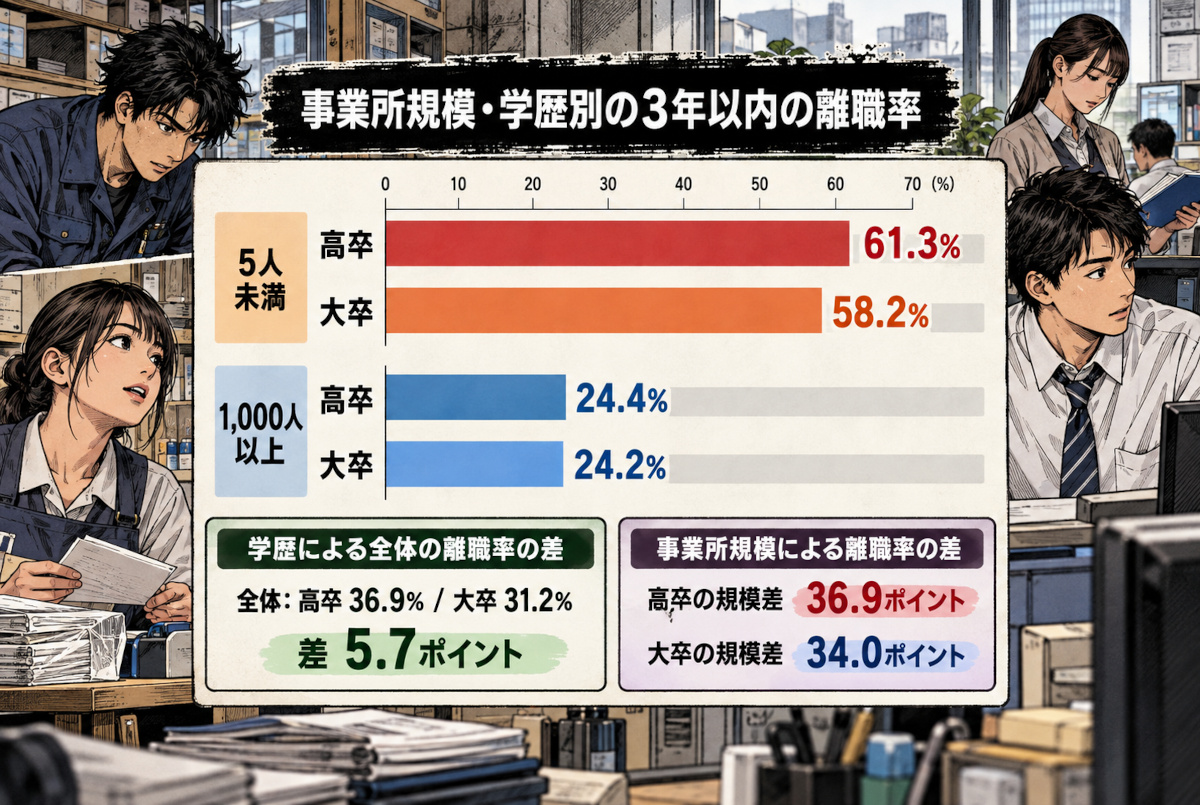
Based on MHLW data released October 23, 2026, covering graduates who entered employment in 2023. The overall high school-versus-university separation-rate difference was 5.7 percentage points, compared with workplace-size differences of 36.9 points for high school graduates and 34.0 points for university graduates. The Japanese labels refer to education level, workplace size and separation rates. These are descriptive comparisons, not evidence that workplace size alone caused the differences. Job separation does not necessarily mean unemployment. AI-generated editorial illustration; people and workplaces are fictional.
There are several reasons not to jump to a simplistic conclusion.
Smaller and larger establishments differ in industry, job responsibilities, pay, recruitment practices and workforce composition. The people who enter them may also differ in ways the figures do not measure.
And leaving a job is not automatically a failure. Some workers move to better opportunities.
This does not establish that joining a large company will prevent someone from resigning, or that company size is more important than education in every aspect of a career.
But it does expose a peculiar blind spot in career planning: people can spend enormous amounts of time comparing university entrance scores while barely examining the working conditions of the employers those universities lead to.
High School Graduates Can Build Specialized Careers, Too
One advantage of entering employment earlier is the opportunity to begin accumulating work experience and job-specific skills at a younger age.
Japan also has professional qualifications that do not require a university degree.
Consider the Second-Class Electrician qualification (Daini-shu Denki Koji-shi), a nationally regulated credential for certain electrical installation work.
There are no educational or work-experience prerequisites for taking the examination. After passing and obtaining the required license, a qualified person can perform electrical work within the legally permitted scope.
This offers a practical example of how a career can be built through professional training and certification rather than through a conventional university route.
Of course, holding a certificate does not guarantee a high salary. Nor does it eliminate the educational requirements for occupations that require particular degrees or specialized programs.
Changing employers can also alter someone’s career trajectory.
According to MHLW’s 2025 Survey on Employment Trends, 40.8% of the surveyed workers entering a new job after previous employment reported higher wages than before. Another 31.0% reported lower wages, while 25.5% reported no change.
The figures cover job changers more broadly, not high school graduates alone. They do not prove that changing jobs is a reliable way for someone without a university degree to earn more.
Still, they show that career earnings are not frozen at the moment someone enters their first workplace.
What people learn, which credentials they earn, and whether they can move into better employment can all matter long after their school-leaving qualifications have been decided.
Even Graduates of Less Selective Universities Do Not All End Up in the Same Place
In Part 1, we examined a 2021 paper by Kazunori Shima, a professor at Tohoku University.
His research compared graduates from one humanities or social sciences faculty at each of two universities in Japan’s Tohoku region. One had an entrance-exam deviation score of at least 60, while the other had a score of 40 or below.
These Japanese deviation scores, known as hensachi, are standardized measures commonly used in entrance-exam guidance. They are not international university rankings or direct measures of graduates’ professional ability.
The study estimated average expected rates of return on university education of 9.1% at the more selective institution and 4.0% at the less selective one.
But a graduate from the lower-selectivity institution was also associated with an expected return as high as 12.9%.
The figures suggest that the economic outcomes available to graduates can vary considerably even within a single faculty.
The scope of the research matters, however. It examined particular faculties at two universities and used employment information to estimate future returns. It was not a nationwide 40-year follow-up of university graduates.
In Japan, the expression F-rank university is sometimes used dismissively for institutions perceived as having little entrance-exam selectivity. It is not an official classification, nor is it strictly synonymous with a deviation score below 40.
There is also no nationally representative dataset in the sources examined here that directly compares the lifetime earnings of academically high-performing high school graduates with graduates of so-called F-rank universities.
Claiming that university reputation determines everyone’s earnings would go beyond the evidence. But claiming that a talented high school graduate will always overtake a low-ranked university graduate would be just as unjustified.
From Age 18 to 58: What Would It Take to Overtake the Other Path?
Let’s stop making predictions about actual people and build a transparent financial model instead.
In Part 2, we estimated approximately ¥5.31 million in payments for four years at a private university, along with approximately ¥10.43 million in potential wages forgone by not entering employment immediately after high school.
That produced a combined economic comparison cost of approximately ¥15.74 million.
Now imagine two individuals choosing different paths at age 18. One starts working immediately. The other studies for four years and begins full-time employment at 22.
We compare their economic positions through age 58: 40 years after the initial decision, including 36 years following university graduation.
How much more would the university graduate need to earn each year, from age 22 onward, to recover the modeled cost?
¥15,739,893 ÷ 36 years = approximately ¥437,000 per year.
To make that calculation meaningful, we tested three hypothetical annual wage advantages for the university graduate.
| University graduate’s annual wage advantage from age 22 | Accumulated over 36 years | Balance after modeled education cost |
|---|---|---|
| ¥300,000 per year | +¥10.80 million | Approx. ¥4.94 million short |
| ¥450,000 per year | +¥16.20 million | Approx. ¥460,000 ahead |
| ¥800,000 per year | +¥28.80 million | Approx. ¥13.06 million ahead |
Original hypothetical calculations by the editorial team. Both individuals are assumed to remain employed, with the same annual wage difference for all 36 years after age 22. The approximately ¥15.74 million comparison cost incorporates four years of university payments and potential earnings forgone. The wage model uses scheduled earnings rather than bonuses and other compensation. Taxes, social insurance, differences in living expenses, unemployment, inflation, discounting and other career changes are excluded. These are not observed average earnings for real high school or low-ranked university graduates.
This is not a longitudinal study tracking academically gifted high school graduates and university graduates for 40 years.
It is a calculation designed to identify the conditions under which one path becomes economically more advantageous than the other.
With a constant annual wage advantage of ¥450,000 after graduation, the university route would just recover its modeled cost by age 58.
At ¥300,000 per year, it would remain nearly ¥4.94 million short.
At ¥800,000 per year, the university route would finish approximately ¥13.06 million ahead in the model.
If a high school graduate develops specialized skills, earns promotions or moves into better-paid work and eventually earns as much as—or more than—the university graduate, the assumed university wage premium may disappear altogether.
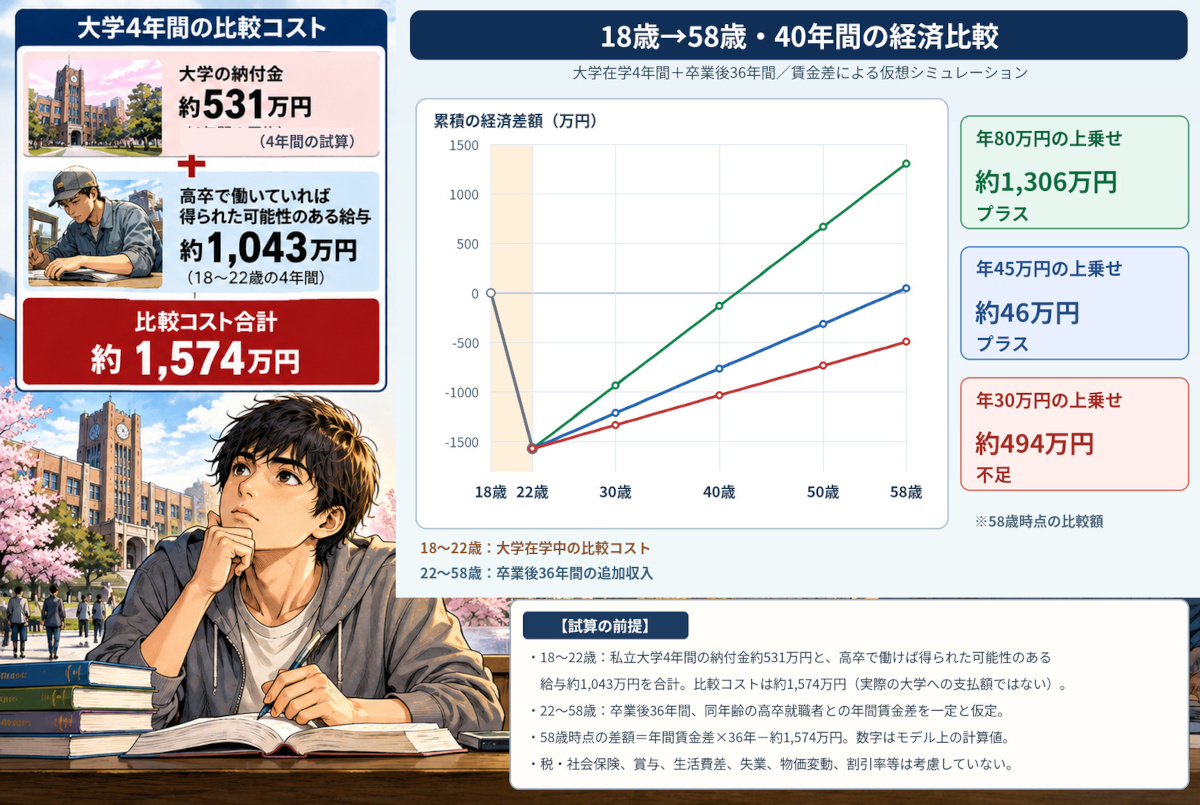
Original hypothetical model. Four years of private university fees (approximately ¥5.31 million) and potential wages forgone from ages 18 to 22 (approximately ¥10.43 million) produce a comparison cost of ¥15.74 million. For the 36 years from ages 22 to 58, constant annual wage advantages of ¥300,000, ¥450,000 and ¥800,000 produce balances of approximately ¥4.94 million short, ¥460,000 ahead and ¥13.06 million ahead, respectively. The Japanese chart labels show these assumptions and outcomes. Taxes, social insurance, living-cost differences, unemployment, inflation and discounting are not included. This is not an actual earnings history or a judgment about personal success. The people and campus imagery are fictional editorial illustrations.
In this model, the deciding factor is not the university’s entrance-exam ranking itself, but the size and duration of the earnings difference that actually develops afterward.
That does not mean the degree is irrelevant. A university qualification may influence which jobs someone can apply for, the employers willing to hire them and the opportunities available later.
The model isolates the financial requirement for breaking even. It does not claim that educational qualifications have no effect on how those earnings differences arise.
A University Place Is Not a Guarantee: Under-Enrollment and Dropout Risks
There is another question parents and students should ask before committing to a university: how stable is the institution, and how likely is the student to complete the program?
According to the Promotion and Mutual Aid Corporation for Private Schools of Japan, 275 of the 595 private universities included in its 2026 enrollment survey failed to fill their approved first-year admission quotas.
That is 46.2% of the institutions surveyed, down from 53.2% in the previous year.
The figure sounds alarming, but it needs careful interpretation.
A university can be counted as below quota even if it enrolls just one student fewer than its approved number. Under-enrollment therefore does not automatically mean imminent closure or severe financial distress.
Nor are low-ranked universities and under-enrolled universities interchangeable categories.
Dropout statistics require similar caution.
On October 16, 2026, MEXT released figures for the 2025 academic year showing 51,029 university dropouts, equivalent to 1.97% of the university student population used in the survey.
The overall institutional response rate for the survey was 91.3%.
Crucially, 1.97% is an annual figure, not the percentage of a particular entering class that drops out before completing a four-year degree.
It cannot be used directly as an individual’s four-year probability of leaving university.
Before selecting an institution, students and parents should therefore look beyond the entrance score. Published completion rates, employment destinations, professional qualification results, student support services and financial information can all be relevant.
After 40 Years, Who Really Comes Out Ahead?
Japan’s statistics show substantial demand for workers entering employment directly after high school. Professional qualifications and job changes can also create opportunities to build a career without first attending university.
At the same time, a university degree can open doors that might otherwise remain closed, and university graduates earn higher wages on average, as we established in Part 1.
Whether university attendance pays for itself financially depends partly on the earnings advantage that actually follows graduation—and on how long that advantage lasts.
The question for a high school student should not simply be, “Will I be a loser if I don’t attend university?” Nor should it be, “Is a low-ranked university automatically a waste of time?”
A more useful decision comes from examining four things: the qualifications needed for the desired occupation, the actual cost of education, the destinations of previous graduates, and the working conditions offered by potential employers.
A degree can be a worthwhile investment. But a career that begins directly after high school is not automatically a losing choice.
And no one can reliably predict the outcome of a 40-year working life from an entrance-exam score at 18.
Editor’s Note
What bothered me most while researching this series was how thoroughly people can investigate a university’s name and entrance-exam ranking without knowing much about where its graduates actually end up working.
An entrance-exam score is basically a measure of academic performance at the point of admission. Somehow, it often gets treated as though it were a report card for the next 40 years of someone’s life.
That strikes me as a rather strange leap.
Of course, graduating from a respected university can be valuable. But so can entering a trade, becoming genuinely skilled and turning into the person everyone at work relies on.
Equally, earning a degree does not mean someone can live off the diploma forever without developing further abilities.
The outcome of a life is not settled at 18. Yet the money and time committed to an early decision cannot simply be recovered by changing one’s mind.
That is why I would rather examine the jobs waiting beyond the university gates than spend all my time staring at its admission ranking.
“Just get any degree” is easy advice to give. So is “Don’t bother with a low-ranked university.”
What irritates me is how casually people can reduce somebody else’s future to either of those slogans.
The Value of a Low-Ranked University Degree — Three-Part Series
Is a degree from a low-ranked university worth it? Across three articles, we examine wage differences, the real costs of university education, and the long-term career outcomes of university graduates compared with those who enter the workforce after high school.
- Part 1: Is a Low-Ranked University Degree Still Worth It? Japan’s Wage Data Have a Catch (Part 1)
- Part 2: ¥5.31 Million in Fees, ¥10.43 Million in Forgone Wages: Does University Pay Off? (Part 2)
- Final Part: High School vs. a Low-Ranked University: Who Comes Out Ahead After 40 Years? (Final Part)
Terms That May Need a Quick Explanation
- Job Openings-to-Applicants Ratio
- The number of available positions divided by the number of registered job seekers in a particular recruitment system. A ratio of 4.12 means approximately 4.12 openings per applicant overall. It does not guarantee that every applicant has four suitable jobs to choose from.
References
- Ministry of Health, Labour and Welfare (MHLW), “Employment Offers, Job Seekers and Placement Results for March 2026 Junior and Senior High School Graduates” (in Japanese). Published in 2026. Source for the 4.12 job openings-to-applicants ratio and 98.9% job-offer acceptance rate.
- Ministry of Education, Culture, Sports, Science and Technology (MEXT), “Employment Status Survey of Fiscal 2025 Graduates, as of April 1, 2026” (in Japanese). Published May 22, 2026. Source for the 98.0% university graduate employment rate.
- MHLW, “Job Separation Rates Within Three Years of Employment for March 2023 Graduates” (in Japanese). Published October 23, 2026. Primary source for separation rates by educational attainment and establishment size.
- Electrical Engineer Examination Center, “Overview of Electrician Qualifications” (in Japanese). Official information on the examination system and permitted scope of electrical work.
- MHLW, “2025 Survey on Employment Trends: Summary of Results” (in Japanese). See the section on wage changes among employees entering jobs after previous employment.
- Kazunori Shima, “Empirical Study on Rate of Return to University Education Investment by University Rank and Faculty: Focusing on the Possibility of Failure in University Education Investment,” Nagoya Journal of Higher Education, Vol. 21 (2021) (in Japanese). Source for expected returns at the two universities studied.
- Promotion and Mutual Aid Corporation for Private Schools of Japan, “2026 Trends in Applications and Enrollment at Private Universities and Junior Colleges” (in Japanese). Published August 2026. Source for the 275 out of 595 universities below admission quota.
- MEXT, “Survey Results on Student Dropouts and Leaves of Absence in Academic Year 2025” (in Japanese). Published October 16, 2026. Source for the 51,029 university dropouts, 1.97% annual proportion and survey response rate.
- MEXT, “Survey Results on Student Payments for Entrants to Private Universities and Other Institutions in Academic Year 2025” (in Japanese). Underlying fee data used in the 40-year comparison model.
- MHLW, “2025 Basic Survey on Wage Structure,” Table 3: Wages by Educational Attainment, Sex and Age Group (in Japanese). Underlying wage data used to estimate the opportunity cost of university attendance.