


On November 13, 2026, USD/JPY briefly climbed above 160. With expectations of another Federal Reserve rate hike gathering momentum, it looked like a familiar story: the Japanese yen was weakening again.
But something didn’t add up. EUR/JPY was falling. So was AUD/JPY.
How could the yen be losing ground against the US dollar while gaining ground against the euro and Australian dollar? Was this really another wave of yen weakness, or was something else driving the market?
We went back to the official exchange-rate data from the Bank of Japan and the Reserve Bank of Australia. Breaking down the currency moves revealed a very different picture from the one suggested by USD/JPY alone.
USD/JPY Rose While EUR/JPY Fell
Rather than mixing quotes from different trading sessions, we began with the Bank of Japan’s published exchange rates for November 10 and November 18, 2026. Both observations were taken at 5:00 p.m. Japan Standard Time (JST), using the midpoint of the quoted bid and ask rates.
| Currency Pair | Nov. 10 | Nov. 18 | Change |
|---|---|---|---|
| USD/JPY | 158.015 | 159.350 | +0.84% |
| EUR/JPY | 177.63 | 174.85 | -1.57% |
| EUR/USD | 1.12410 | 1.09725 | -2.39% |
Source: Bank of Japan, Foreign Exchange Rates. Percentage changes independently calculated. USD/JPY and EUR/JPY are quoted in yen; EUR/USD is quoted in US dollars. Figures are rounded.
Over six trading-day intervals, USD/JPY rose 0.84%, meaning the yen weakened against the dollar. Yet EUR/JPY fell 1.57%, meaning the yen strengthened against the euro.
The same currency was moving in opposite directions, depending on which other currency it was compared with.
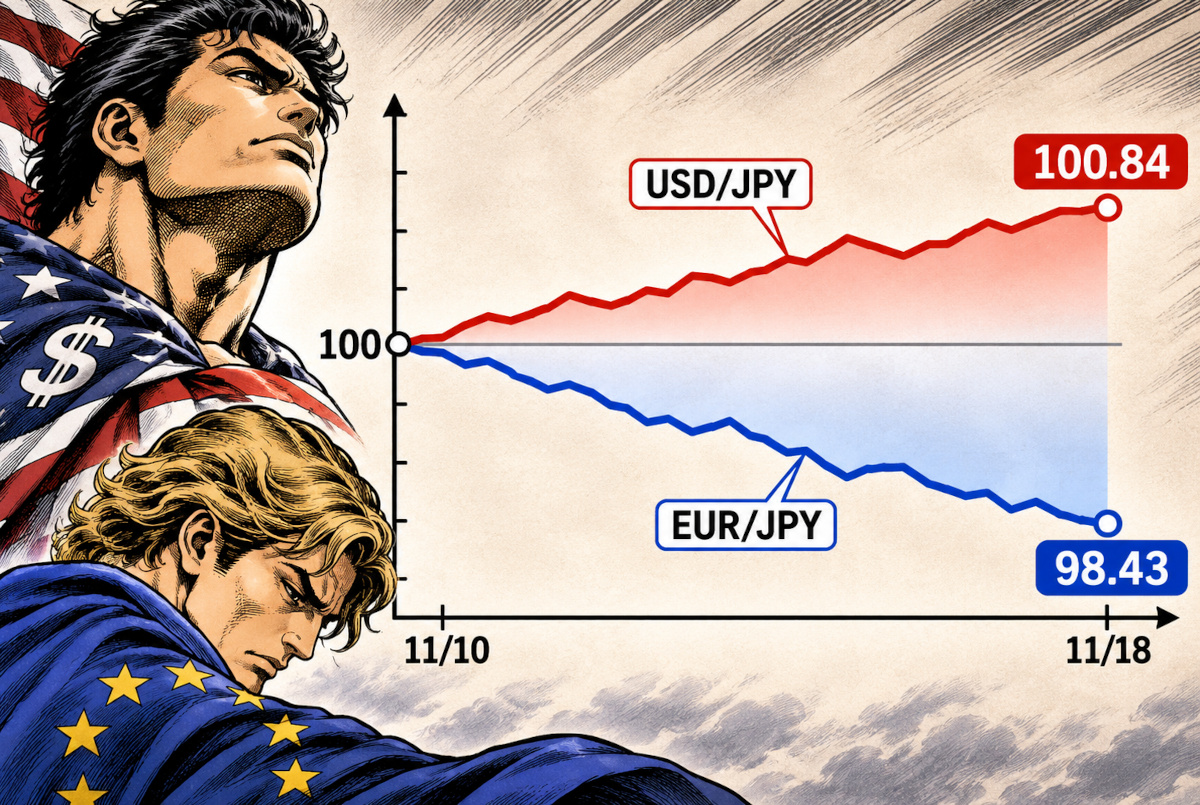
With November 10 set to 100, USD/JPY reached 100.84 and EUR/JPY fell to 98.43 on November 18. The lines between the endpoints are illustrative, not a reconstruction of actual daily price movements. Source: Bank of Japan; original calculations.
We Broke Down EUR/JPY’s Fall. The Numbers Were Revealing.
For anyone trading yen crosses, the relationship is straightforward:
EUR/JPY = EUR/USD × USD/JPY
EUR/JPY can therefore fall even while USD/JPY rises. All it takes is a sufficiently large decline in EUR/USD.
But how much did each currency pair contribute to the actual move?
We decomposed the change in EUR/JPY between November 10 and November 18. To avoid assigning the entire interaction between the two changing exchange rates to just one factor, we split that interaction equally between them.
Breaking Down the EUR/JPY Decline (Nov. 10–18)
Contribution from USD/JPY: +¥1.48
Contribution from EUR/USD: -¥4.26
Combined change: approximately -¥2.78
The rise in USD/JPY actually pushed EUR/JPY upward by approximately ¥1.48. But the weakening euro against the dollar pulled EUR/JPY down by approximately ¥4.26.
The second force overwhelmed the first.
The key finding is that EUR/JPY’s decline was not simply a story of investors buying yen. The euro’s weakness against the US dollar was the dominant factor.
The decomposition uses the midpoint of each factor’s value at the start and end of the comparison period. Small differences from the directly quoted EUR/JPY change reflect rounding and independently published bid-ask quotes.

Original decomposition of the approximately ¥2.78 EUR/JPY decline from November 10 to 18, 2026. USD/JPY contributed about +¥1.48 and EUR/USD about -¥4.26. All figures represent contributions expressed in yen, not changes in the quoted EUR/USD rate. The interaction term is divided equally. Source: Bank of Japan; original calculations.
Australia Raised Rates. So Why Was AUD/JPY Falling?
Perhaps this was merely a euro-specific problem. To test that possibility, we examined another yen cross: AUD/JPY.
The Reserve Bank of Australia’s official data show that AUD/JPY fell from ¥107.35 on November 17 to ¥106.96 on November 18. Over the same two observations, AUD/USD declined from 0.6742 to 0.6720.
We used those published rates to derive the corresponding USD/JPY values, then decomposed the ¥0.39 fall in AUD/JPY using the same method as before.
Approximately ¥0.35 of that decline, or about 90%, came from the Australian dollar’s weakness against the US dollar. The USD/JPY component accounted for only about ¥0.04.
These RBA observations form a separate comparison from the Bank of Japan’s 5:00 p.m. JST figures used earlier. They should not be treated as simultaneous quotes from the same market session.
Now for the curious part. On November 3, the RBA had raised its cash rate target to 4.85%. Japan’s policy rate stood at 1.25%, leaving an interest-rate difference of 3.60 percentage points.
Australia offered a much higher policy rate, yet its currency was still falling against the yen.
Why?
The RBA’s November meeting minutes discussed rising unemployment, weakness in the housing market and the potential economic costs of further tightening. Those concerns can affect expectations about where interest rates will go next, not just where they stand today.
Meanwhile, expectations of renewed US rate increases and nervousness in equity markets could encourage investors to reduce exposure to higher-yielding or risk-sensitive currencies.
That is a plausible explanation for the pressure on AUD/JPY. It is not, however, proof that a large-scale unwinding of yen-funded carry trades was taking place.

Between November 17 and 18, 2026, AUD/JPY declined by approximately ¥0.39. The AUD/USD component accounted for about -¥0.35, while the USD/JPY component contributed about -¥0.04. Australia’s policy rate was 4.85%, versus Japan’s 1.25%. The illustration compares these conditions; it does not establish that the interest-rate difference caused the currency decline. Sources: Reserve Bank of Australia and Bank of Japan; original calculations.
Fed Rate-Hike Expectations—and the Battle Around 160
So why was the US dollar performing so strongly in the first place?
At the time of this analysis, the Federal Reserve’s policy-rate target range was 3.75% to 4.00%. At its October 28 meeting, the Fed left rates unchanged, but two policymakers dissented in favor of a 25-basis-point increase.
US consumer prices also continued to rise. The headline Consumer Price Index increased 0.4% month over month in October 2026, on a seasonally adjusted basis.
By November 18, markets were effectively pricing in a 25-basis-point Fed rate hike in December, while also assigning some probability to a larger 50-basis-point move. These were market expectations, not decisions already made by the Fed.
Japan presented a different set of pressures. The Bank of Japan was signaling the possibility of further tightening, while currency traders also had to consider the risk of official intervention.
Japan’s Ministry of Finance had already conducted approximately ¥15.4 trillion in yen-buying intervention between late July and early August 2026.
That history matters when USD/JPY approaches 160 again. Expectations of higher US interest rates can support the dollar, but traders selling yen must also consider the possibility of intervention by Japanese authorities.
A stronger US dollar and a broadly weaker Japanese yen are not necessarily the same market phenomenon.
Where Could the Yen Crosses Go Next?
For an FX day trader, watching USD/JPY alone is not enough. The direction of a yen cross also depends on how the other currency performs against the US dollar.
Consider three combinations:
- USD/JPY rises while EUR/USD falls: The two forces oppose each other. EUR/JPY can rise, remain broadly unchanged or fall, depending on their relative magnitudes.
- USD/JPY falls while EUR/USD falls: Both moves put downward pressure on EUR/JPY.
- USD/JPY rises while EUR/USD rises: Both moves put upward pressure on EUR/JPY.
The same principle applies to AUD/JPY. When stocks weaken and investors become more cautious, traders may want to watch whether a decline in AUD/USD is accompanied by a decline in USD/JPY. Those two moves would reinforce downward pressure on AUD/JPY.
But there is no rule that yen crosses must fall whenever USD/JPY reaches or exceeds 160.
There is another useful cross-check. The Bank of Japan’s published nominal effective yen index stood at 73.62 in its November 10 release and 73.43 in its November 18 release. That is a small decline, not evidence of a sustained broad-based recovery in the yen.
These index values refer to the preceding business day, so their observation dates differ from the 5:00 p.m. spot quotes used in our earlier calculations.
As of November 18, the evidence fits a market dominated by US dollar strength better than one experiencing a broad-based yen rally.
Whether the pattern continues depends on what happens next to Fed expectations, Japanese monetary policy, intervention risks and global appetite for risk. The recent divergence is a signal worth investigating, not a guaranteed trading setup.

Schematic illustration of three exchange-rate combinations. In scenario 1, where USD/JPY rises and EUR/USD falls, EUR/JPY can rise, remain flat or fall. The plus signs indicate a combination of directional influences, not a literal addition formula. The exchange rate is calculated by multiplication: EUR/JPY = EUR/USD × USD/JPY.
Editor’s Note
Every time USD/JPY gets close to 160, the headlines start shouting about the weak yen again. Fair enough. But take one look at EUR/JPY or AUD/JPY and the story becomes a lot less tidy.
What bothered me was how easily one exchange rate gets treated as a verdict on an entire currency.
After running the numbers, the dollar looked exceptionally strong, while the yen’s performance depended heavily on what it was being measured against. Add Japan’s intervention risk, and the market becomes even more awkward to describe with a single headline.
And there’s still something odd about a dollar this strong struggling to establish itself above 160 yen.
Financial markets don’t operate like a synchronized chorus where every currency obediently follows USD/JPY. There are other trades going on backstage, and some of them are moving in the opposite direction.
That’s why getting bullish on every yen cross just because USD/JPY is rising feels like a rather expensive shortcut.
References
- Bank of Japan — Foreign Exchange Rates, November 10, 2026 (official bilingual Japanese-English PDF; source of the 5:00 p.m. JST rates).
- Bank of Japan — Foreign Exchange Rates, November 13, 2026 (official bilingual PDF; USD/JPY intraday high of 160.19).
- Bank of Japan — Foreign Exchange Rates, November 18, 2026 (official bilingual PDF; source of the 5:00 p.m. JST rates and nominal effective yen index).
- Reserve Bank of Australia — Exchange Rates (official AUD/USD and AUD/JPY data for November 17 and 18, 2026).
- Reserve Bank of Australia — Monetary Policy Decision, November 3, 2026 (cash rate target raised to 4.85%).
- Reserve Bank of Australia — Minutes of the Monetary Policy Board Meeting, November 3, 2026.
- Federal Reserve — FOMC Statement, October 28, 2026.
- US Bureau of Labor Statistics — Consumer Price Index, October 2026.
- Bank of Japan — Statement on Monetary Policy, October 30, 2026 (official Japanese-language document; overnight interest-rate target of approximately 1.25%).
- Japan Ministry of Finance — Foreign Exchange Intervention Operations, July–September 2026 (official Japanese-language report detailing yen-buying intervention in July and August).
- Reuters — Dollar Higher as Hawkish Waller Backs Aggressive Fed Action, November 18, 2026 (contemporary reporting on US rate-hike expectations and currency markets).
This article analyzes market conditions using information available through November 18, 2026. Exchange rates may differ according to the source and observation time. The illustrations are explanatory artwork and should not be interpreted as actual trading screens or complete historical charts. This analysis does not forecast future exchange rates or constitute investment advice or a recommendation to trade.